

Newsletter 2020.2 Index
Theme : "The Conference of Fluid Engineering Division (February issue)”
|
Dream to Sounds
Takumi FUKUSHIMA, Tokyo University of science
|

Abstract
Team Raspberry, a member of the Department of Mechanical Engineering, Graduate School of Engineering, Tokyo University of Science, received the "Best Prize" at the 17th Flow Dream Contest. The theme of this contest was "Let's express the feel of flow". To achieve this theme, our team first implemented a real-time FFT analyzer (Fig. 1) that measures sound in real time and performs FFT analysis on a small computer, Raspberry Pi. Second, we created a visualizer as shown in Fig. 2 using the information obtained by this analyzer. This visualizer is controlled using the four parameters shown in Fig. 3. The waveform data of about 0.2 seconds is arranged in the circumferential direction, and the sound intensity is defined as the radius of the circle. An overview of the visualizer is generated by these two parameters. The other two parameters are the one that converts the strongest frequency of the sound into color according to the color bar shown in Fig. 3 and the one that shows the number of frequencies that make up the sound to the inner polygon. We represent the sound intuitively by controlling these four parameters at the same time and were good reputation from many visitors. In addition, the other key features is that the device is so small, as shown in Fig. 4, that sound can be visualized anywhere. Through this contest, I was able to think deeply about the mysterious feelings that we feel about sound, and it was a very good opportunity. I thank everyone who made this opportunity and cooperated with this work.
Key words
Sounds, Visualization, Realtime FFT analyzer, Raspberry Pi,
Figures
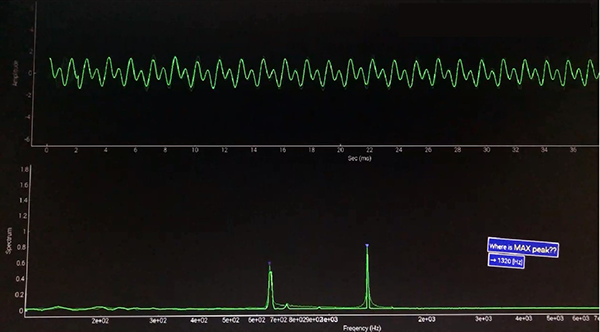
Fig. 1 Screen of real time FFT analyzer
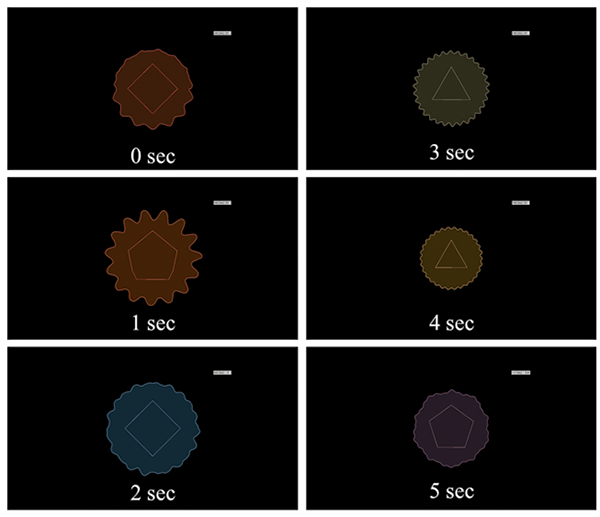
Fig. 2 Visualizer moving to the sounds
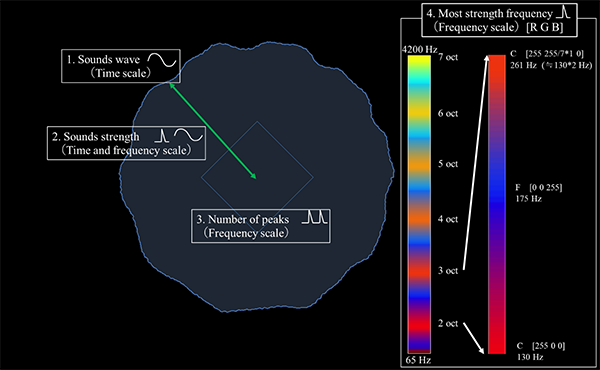
Fig. 3 Visualizer configuration and control parameters
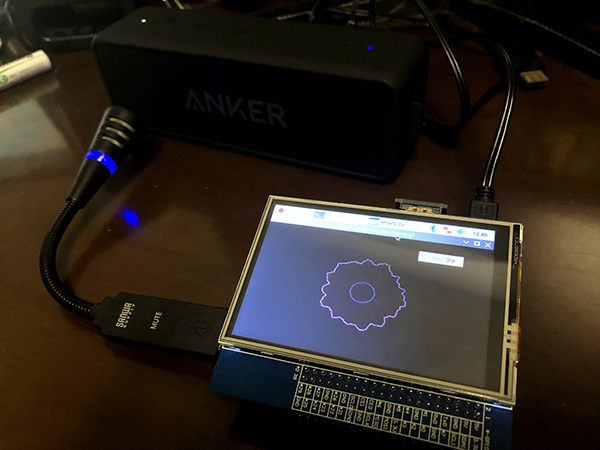
Fig.4 Visualizer connected to 3.5-inch display