

Newsletter 2025.3 Index
Theme : "The Conference of Fluid Engineering Division" (Part 2)"
|
Motion and drag reduction effect of bubbles in a turbulent boundary layer developed beneath a moving wall
 |
| Itsuki MORI, Yasufumi HORIMOTO, Hyun Jin PARK, Yuji TASAKA, Yuichi MURAI (Hokkaido University) |
Abstract
In the present study, a novel laboratory-scale experimental facility was developed to systematically investigate the air lubrication effects induced by air bubble injection in a spatially developing turbulent boundary layer. The facility comprises a transparent acrylic water tank, a belt-driven mechanism, and an air injection system, enabling controlled experiments under well-defined conditions that simulate realistic ship-scale ones. Friction reduction was quantified through torque measurements obtained by a torque meter, while the turbulent flow characteristics were analyzed using particle tracking velocimetry (PTV) to extract detailed velocity fields.
Experiments were performed under varying wall (belt) velocities and air injection flow rates, with measurements conducted in both single-phase and two-phase (bubble-injected) conditions. The analyses revealed that bubble injection consistently contributes to the reduction of wall friction, as evidenced by a significant decrease in the measured torque when bubbles are present. Notably, the friction reduction effect was found to depend on both the wall velocity and the air injection rate. At lower wall velocities (1.20 m/s and 1.64 m/s), bubble injection caused an increase in the relative mean velocity profile, whereas at higher wall velocities (2.08 m/s), the bubbles resulted in a remarkable decrease in Reynolds shear stress. This observation suggests that, under high-speed conditions, bubbles directly modify the turbulent structure, while at lower speeds the friction reduction may be primarily attributed to the apparent density reduction and decreased contact area between wall and water.
These findings provide valuable insights into the fundamental mechanisms underlying air lubrication and establish a robust experimental framework for further investigation. Future works will focus on quantitative evaluation of the local flow modifications induced by bubble passage and comparing these effects across different operating conditions. It will contribute to a more comprehensive understanding of friction reduction mechanisms by bubbles in turbulent boundary layers.
Key words
Gas-liquid two-phase flow, Turbulent boundary layer, Drag reduction, Particle tracking velocimetry
Figures
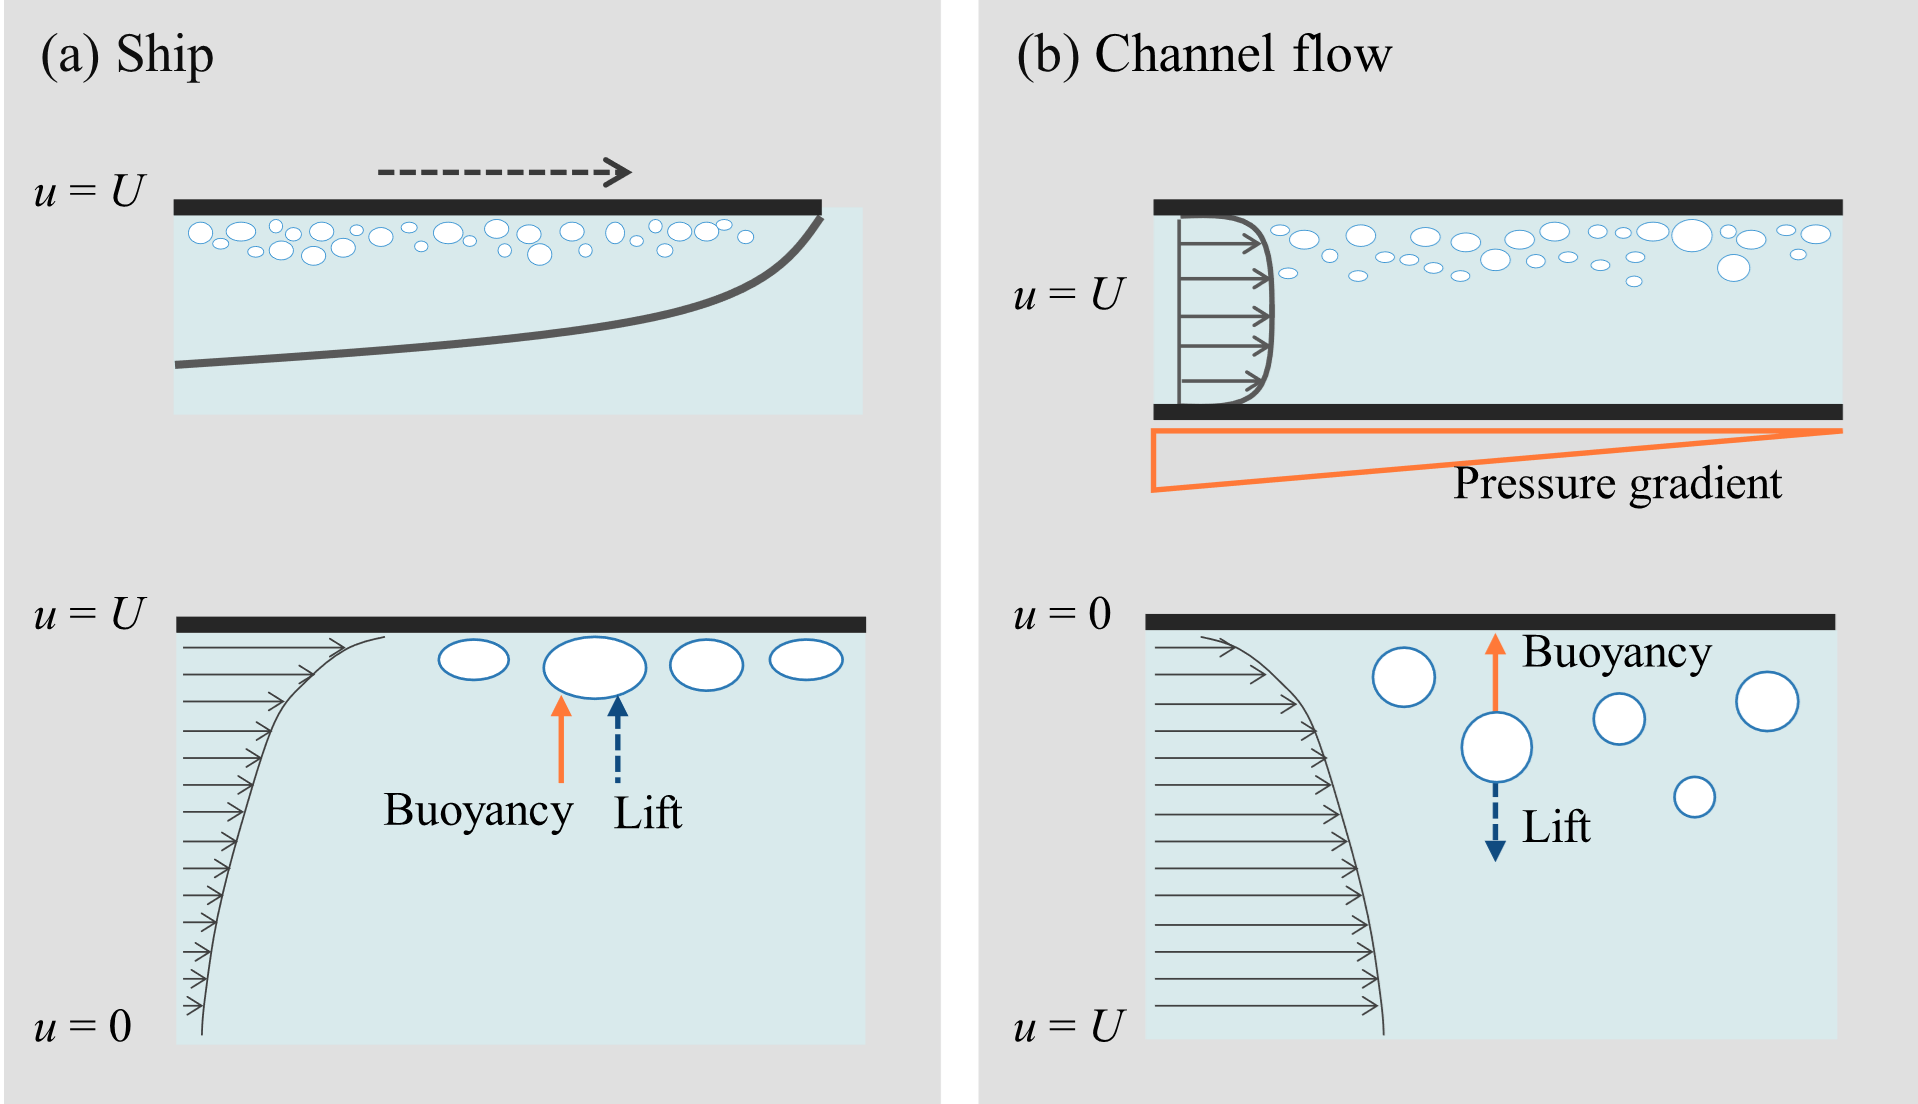
【Figure 1 Conditions (a) beneath a ship and (b) in horizontal channel flow.】
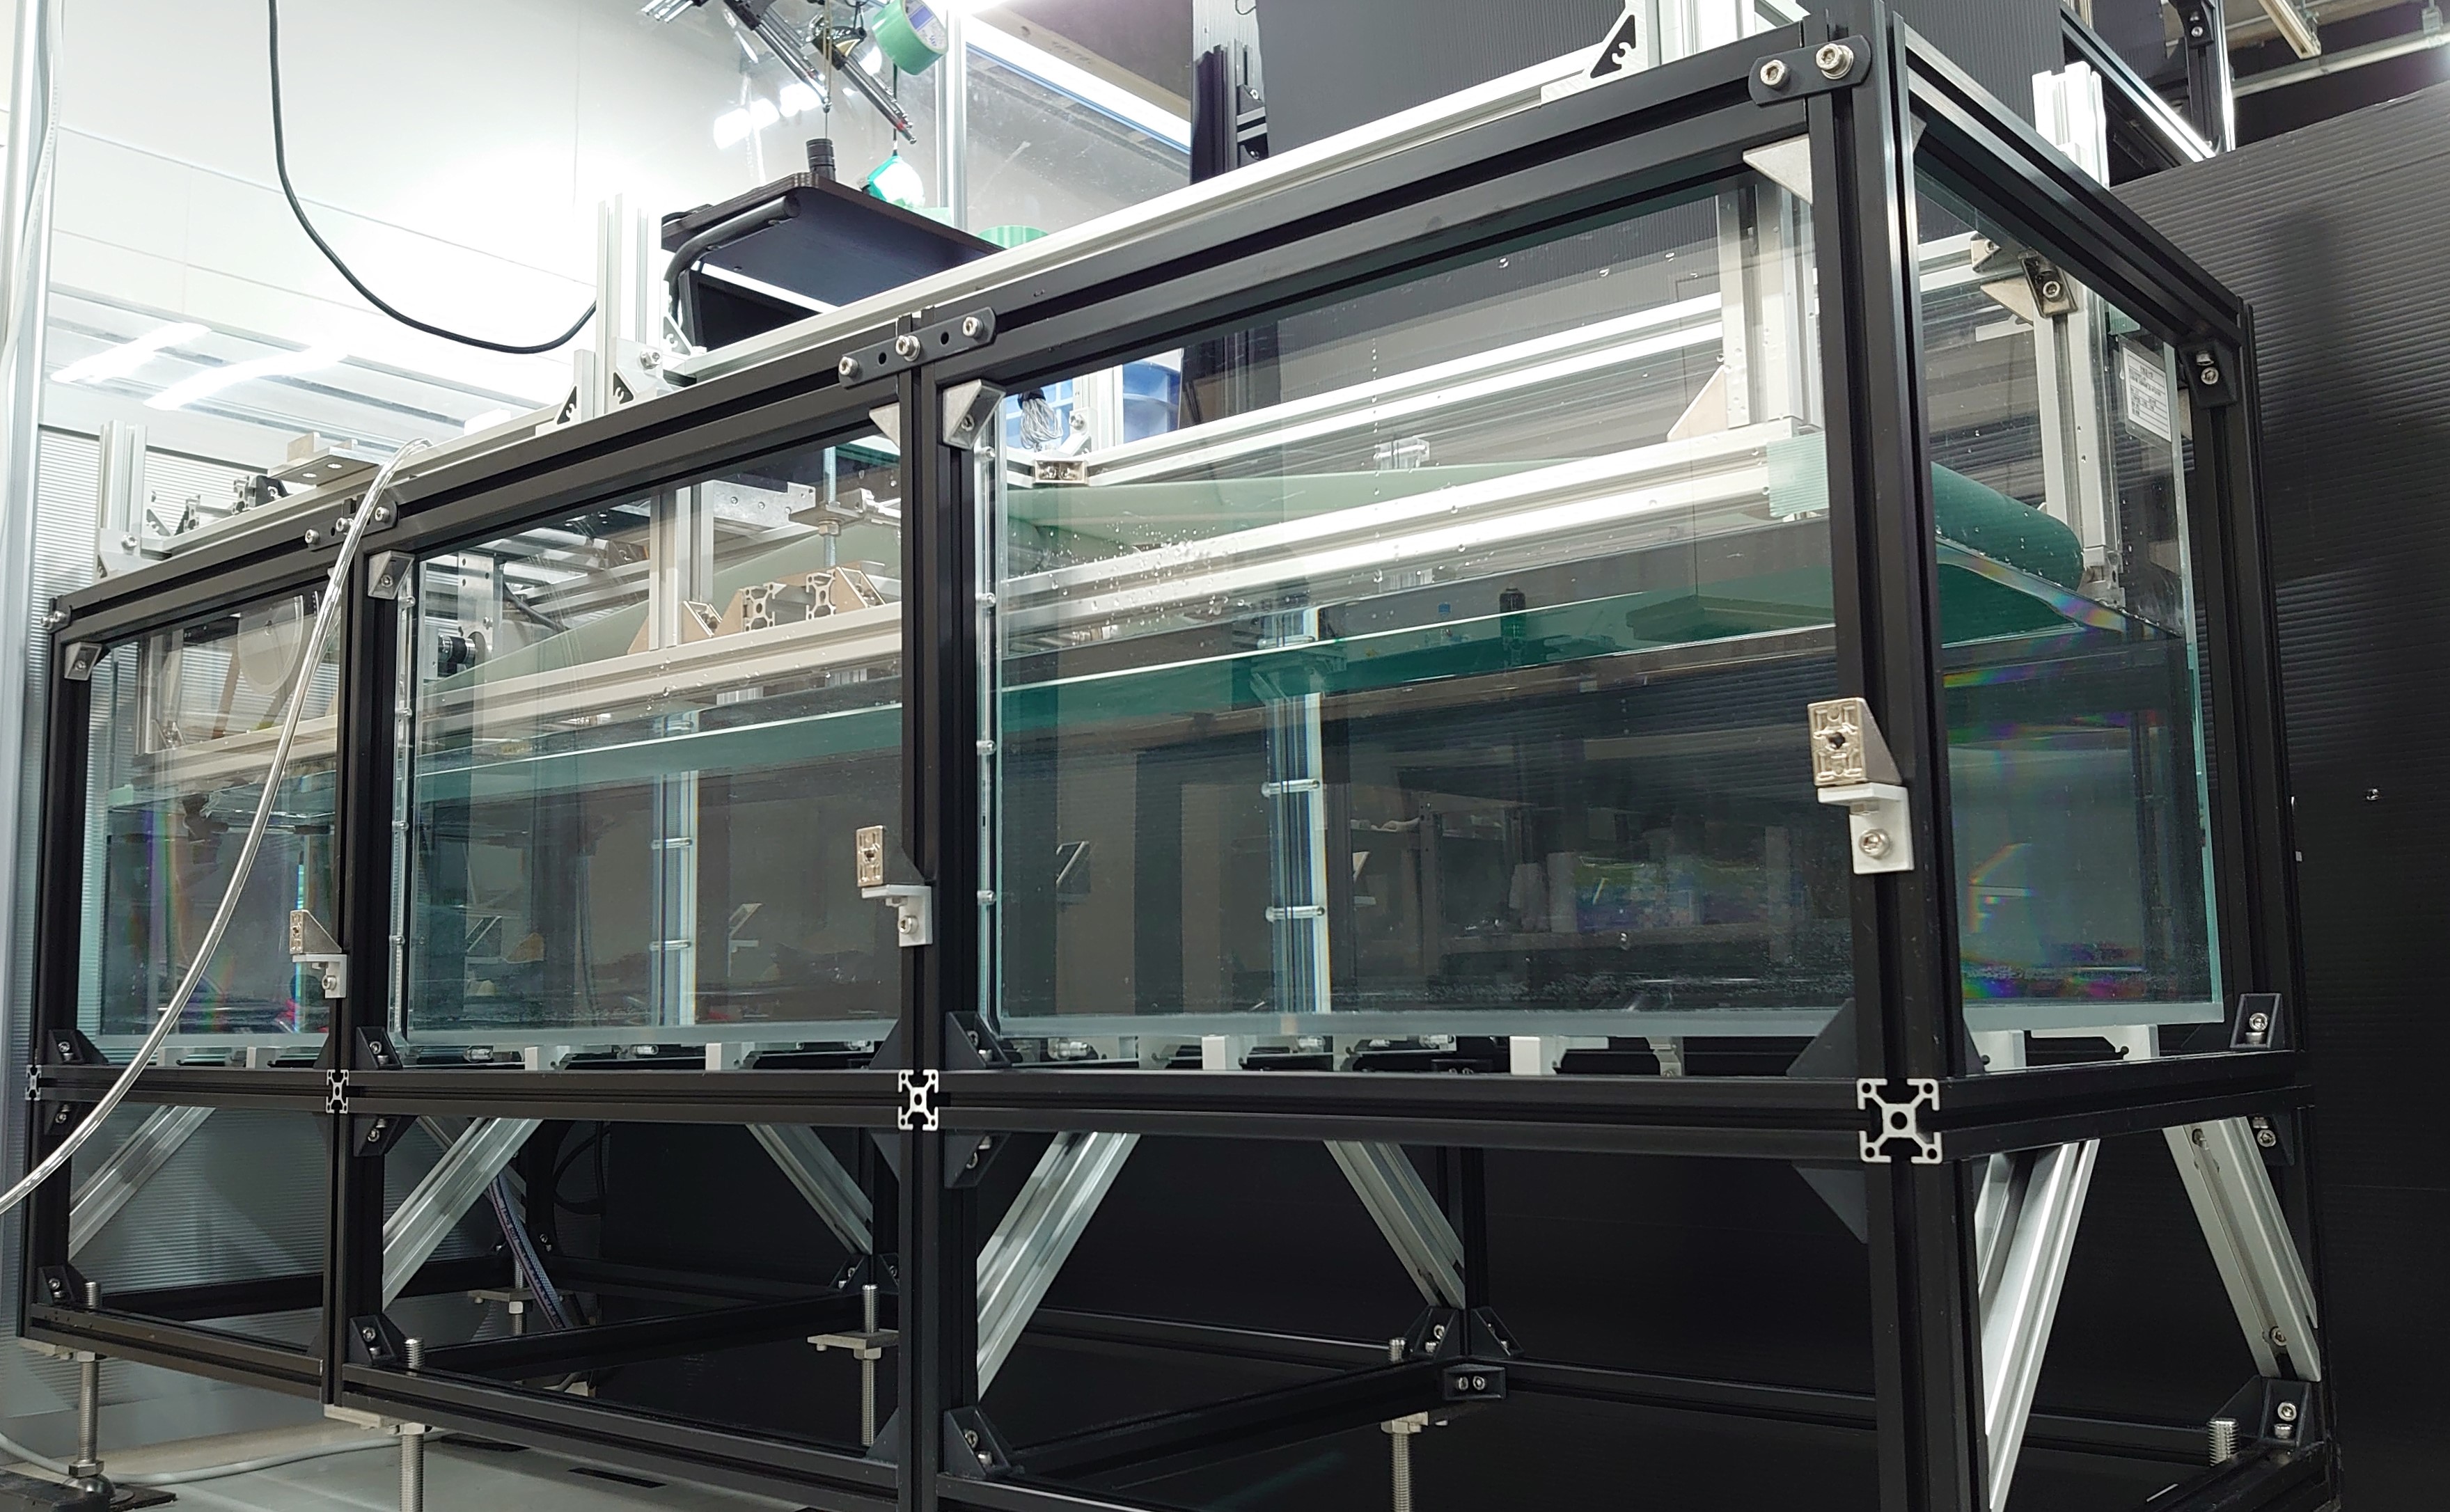
【Figure 2 Photograph of the experimental system used in this study.】
.png)
.png)
【Figure 3 Schematics of (a) the present experimental facility and (b) its side view. The x, y, and z coordinates are aligned in the streamwise, wall-normal and spanwise directions, respectively.】
【Video 1 Turbulent boundary layer developed beneath a moving belt visualized by using light-reflective flakes.】
【Video 2 A video showing the bubble injection area taken from below.】
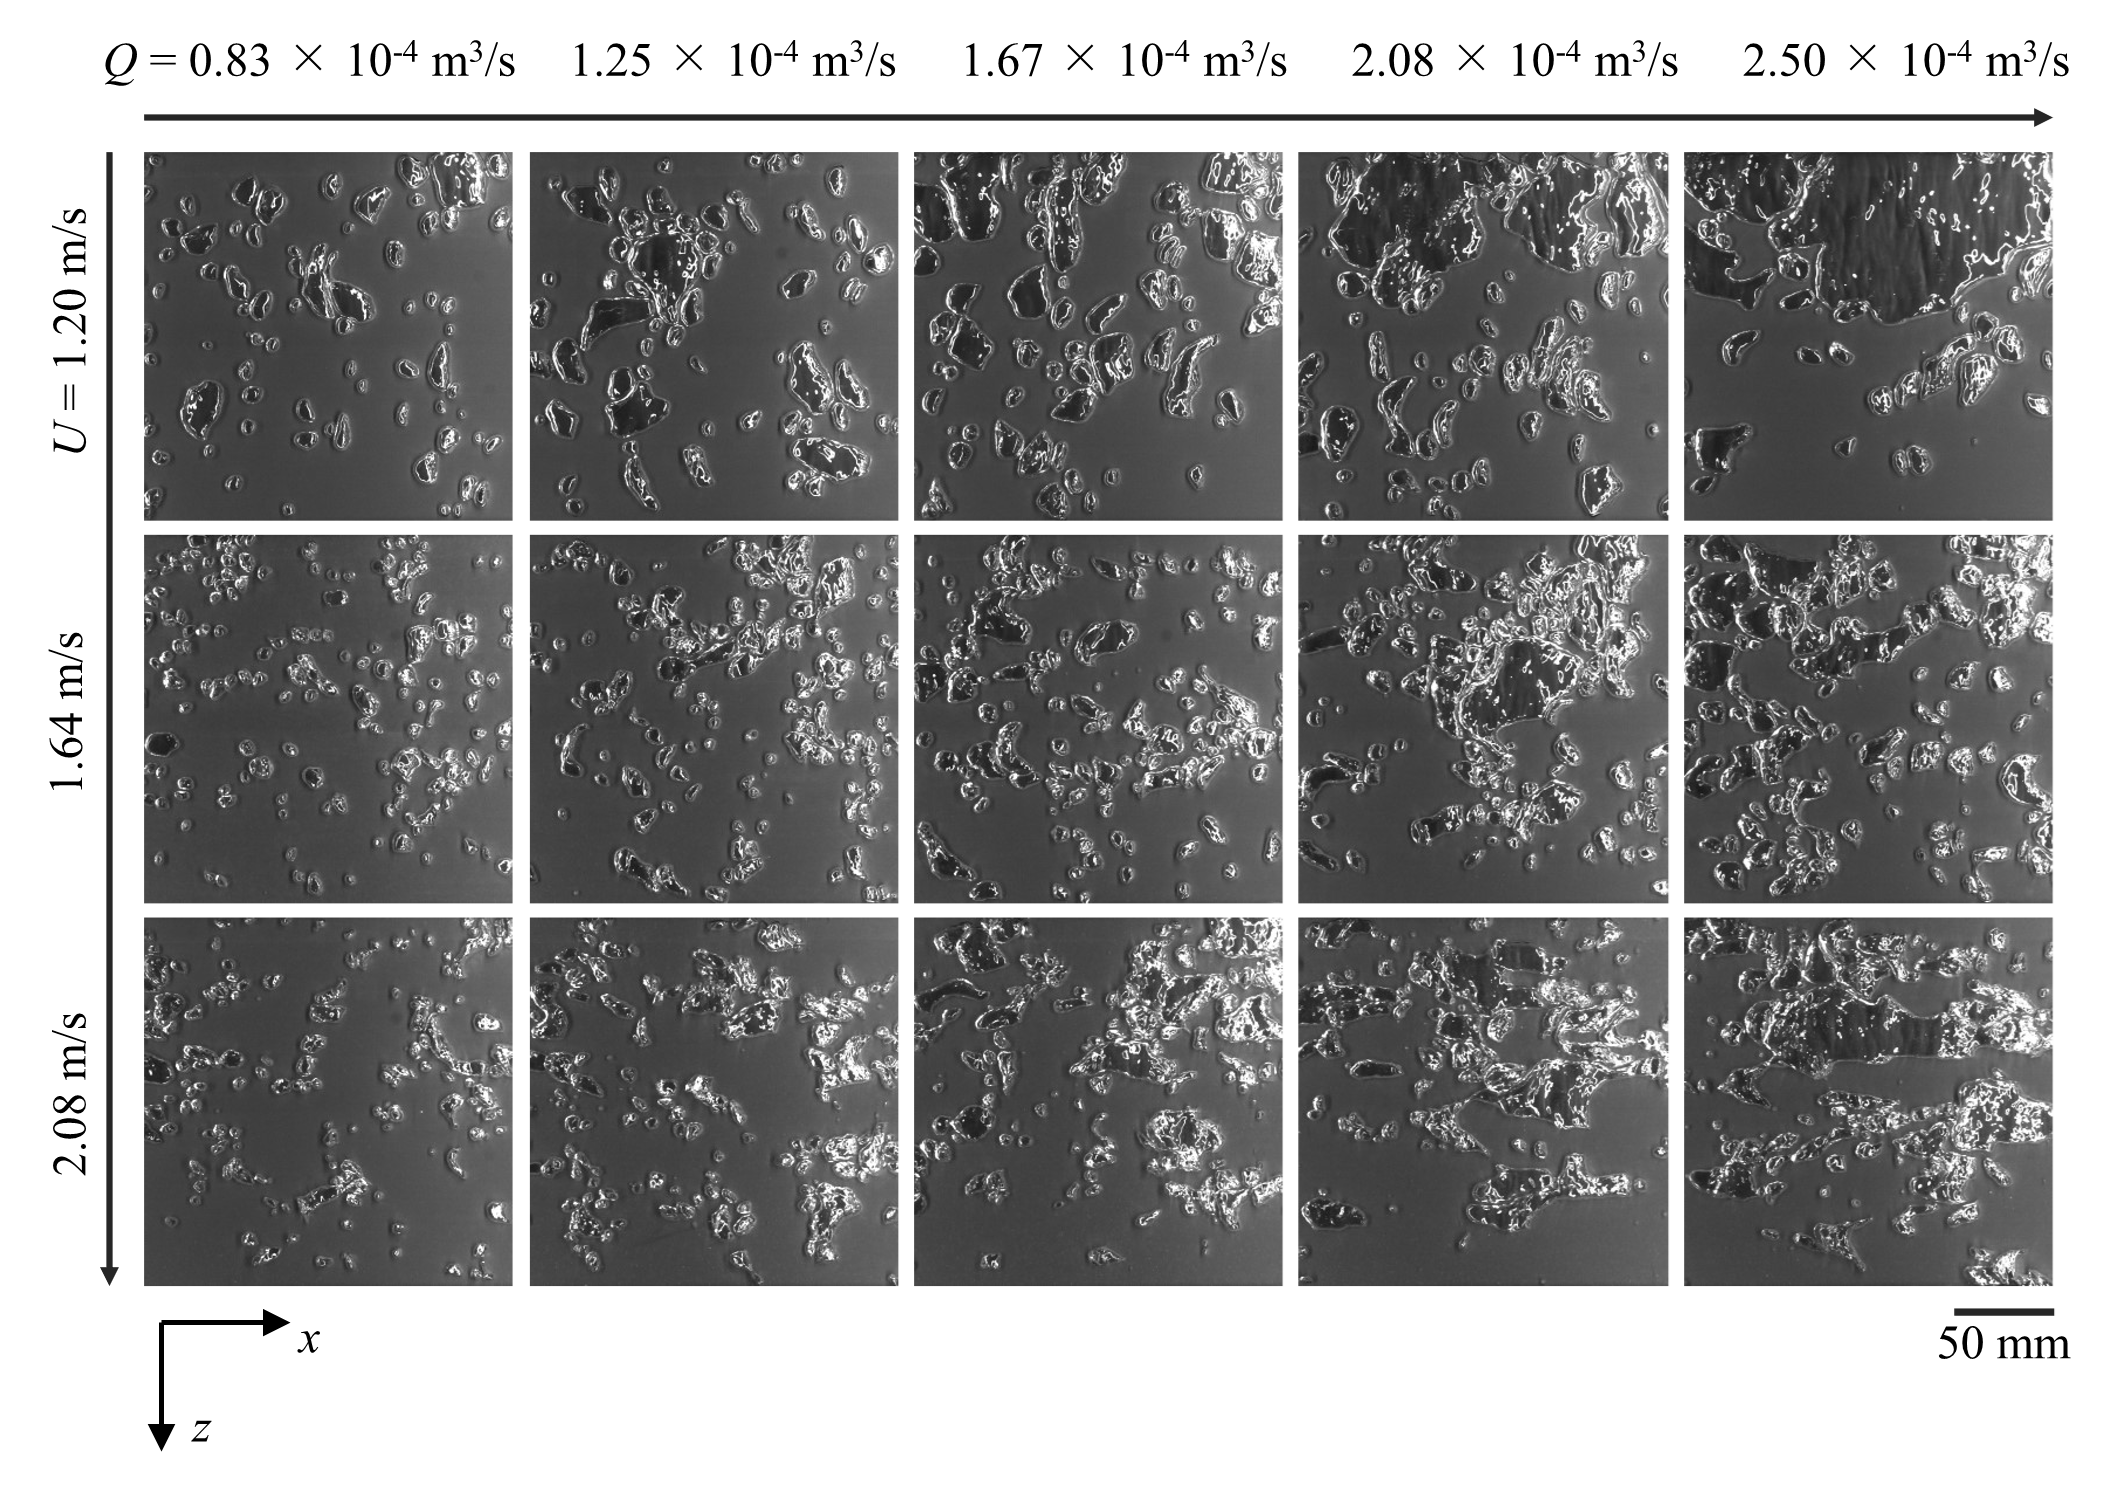
【Figure 4 Photographs of the injected air bubble in 748 mm ≤ x ≤ 932 mm recorded
through the bottom of the water tank.
】
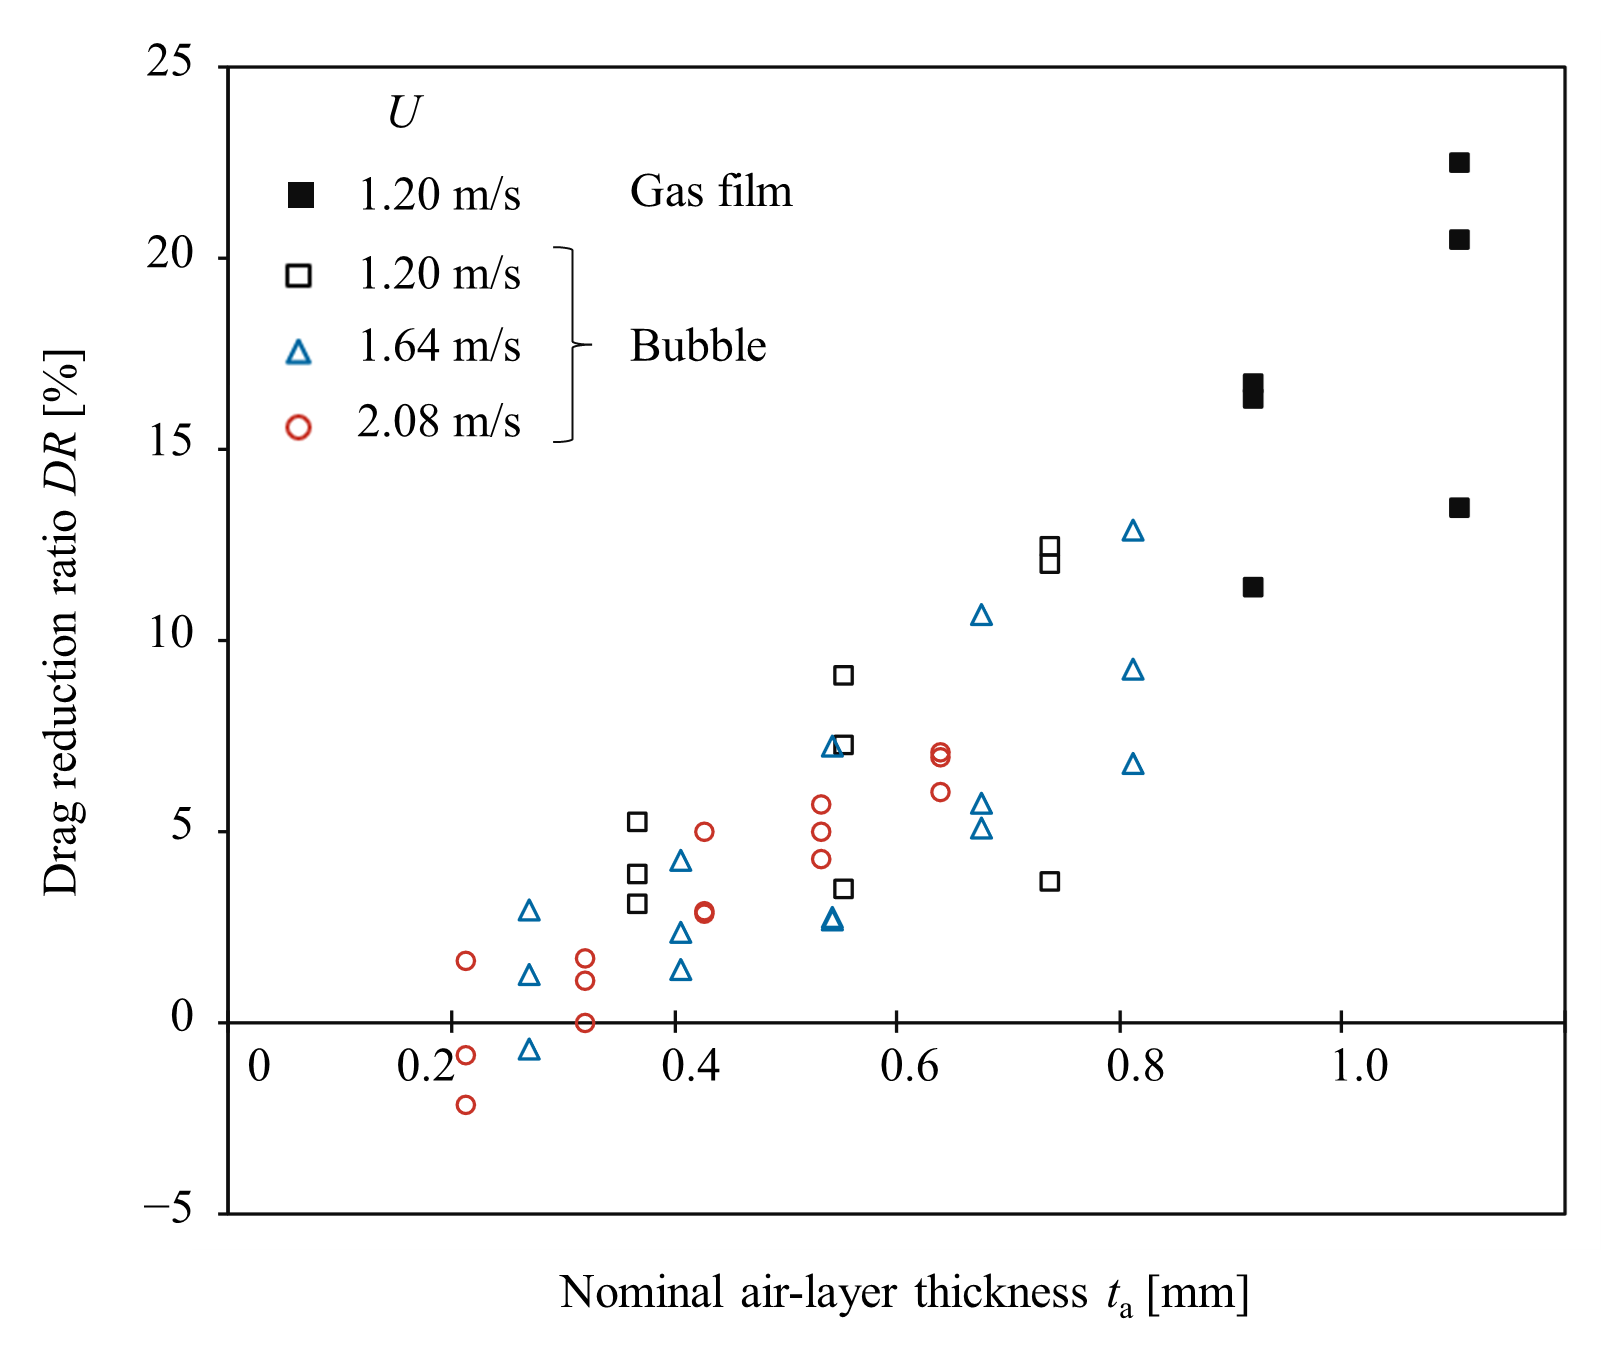
【Figure 5 Drag reduction ratio for each condition.】
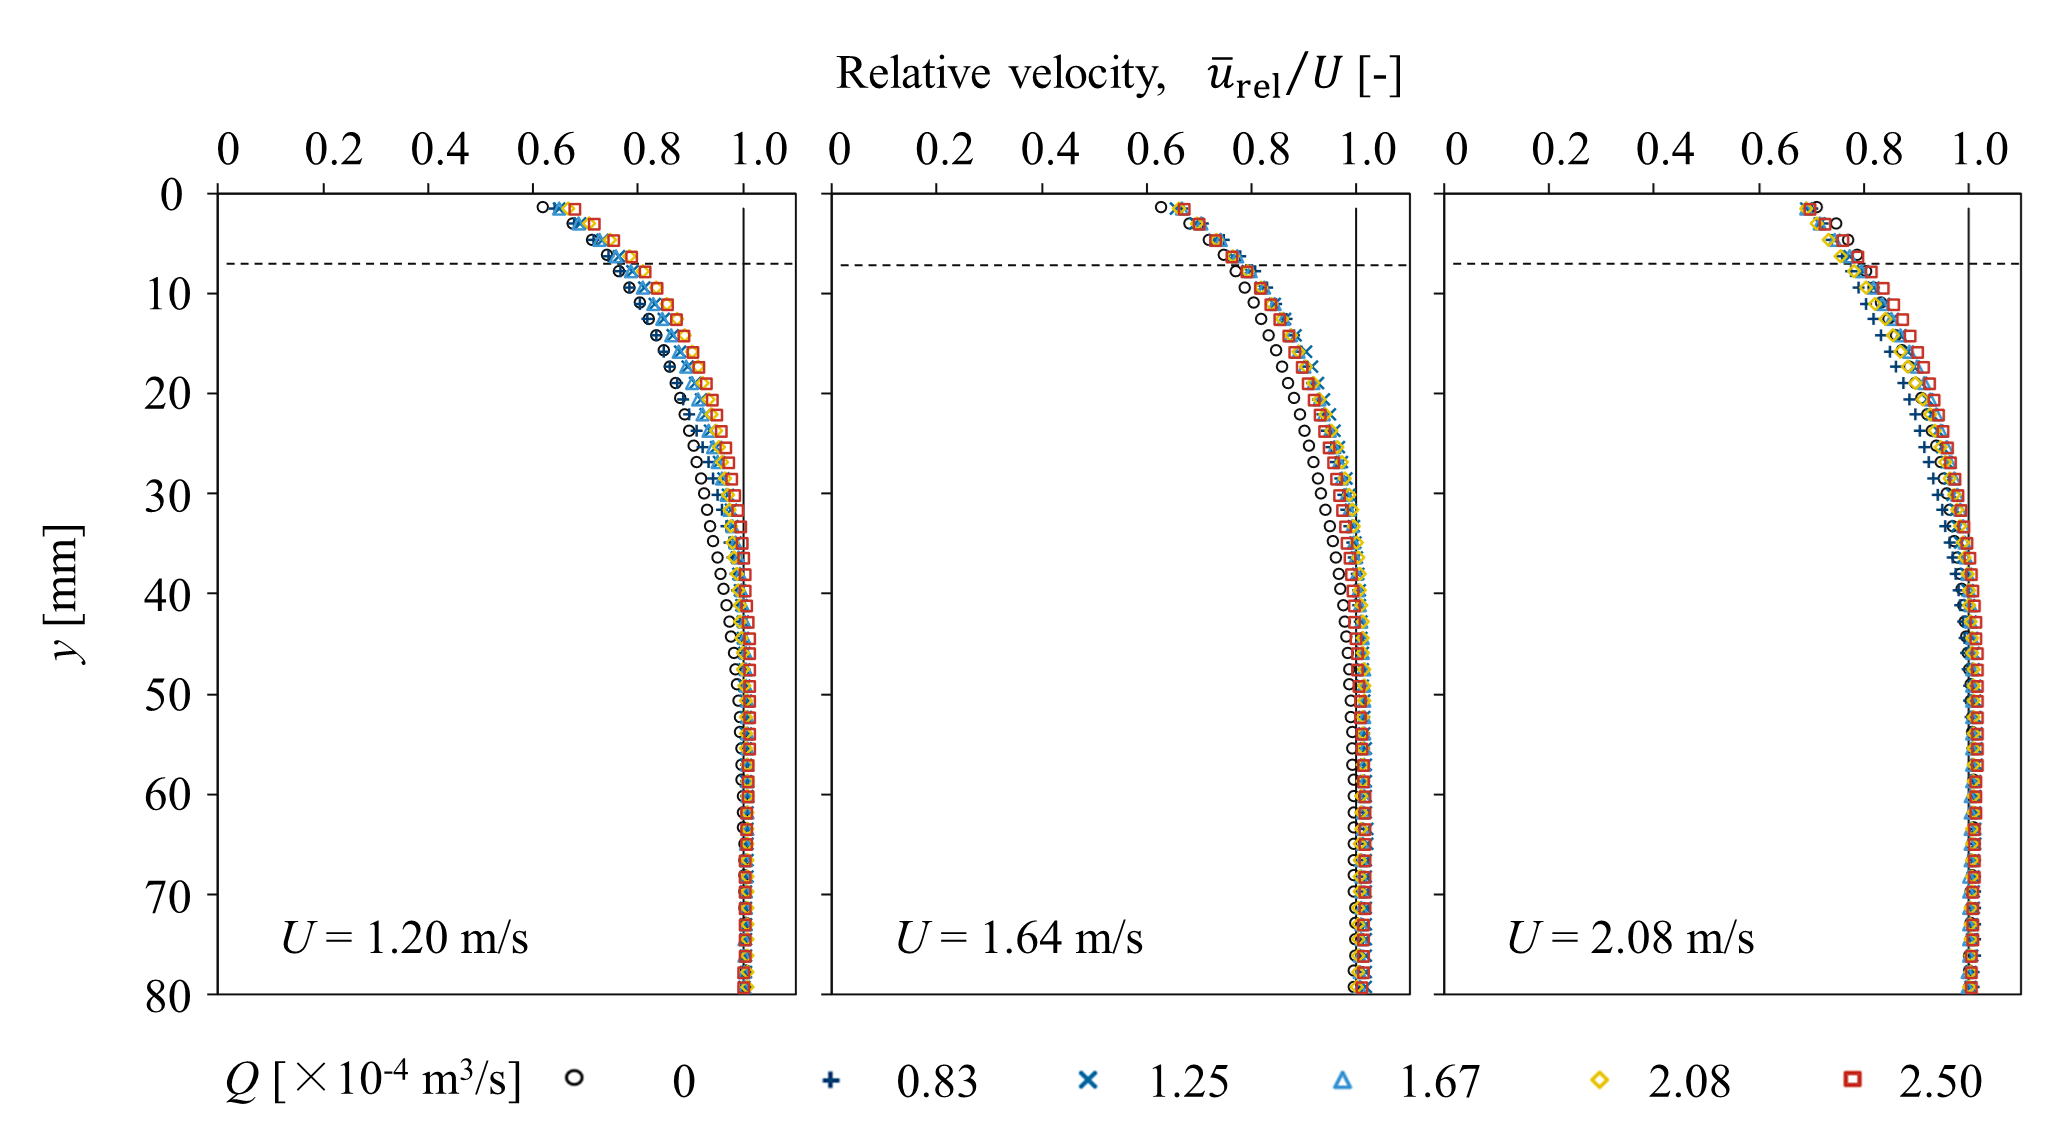
【Figure 6 Mean velocity profile relative to the belt for each air injection rate and belt speed. The solid line in the graph represents the belt speed, while the dashed line indicates the approximate upper boundary of the region where bubbles are present.】
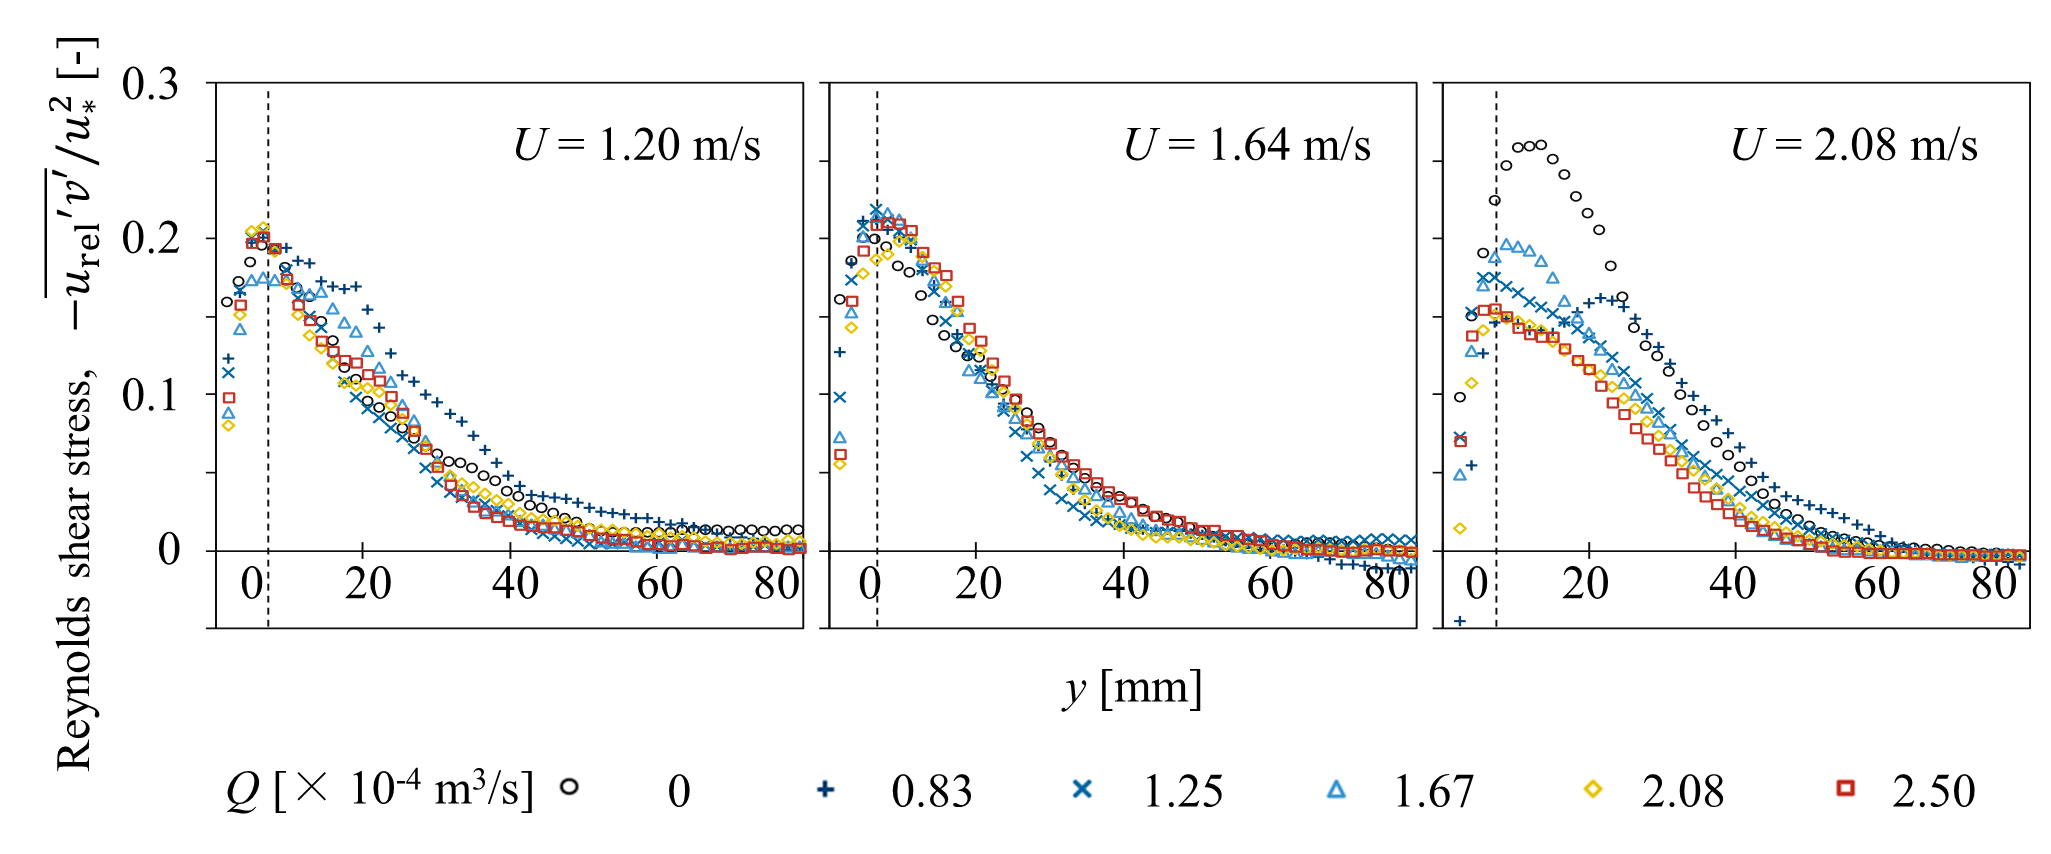
【Figure 7 Reynolds shear stress for each air injection rate and belt speed. Reynolds shear stress is normalized by the wall variables of the single-phase flow. The dashed line in the graph represents the approximate upper boundary of the region where bubbles are present.】